
[#19] : 70 is the new 60 … but does your retirement plan know this?
If you’d been born about 200 years ago, your life expectancy was 30.
It was a brutal time. Back then, half your children didn’t survive to adulthood, and half who did died somewhere between 50 and 70.
Brutal numbers but the arithmetic was simple. Life was short and planning for old age was, for most people, beside the point.
Life expectancy is a climbing target
Today, well over 95% of children survive to adulthood, and less than 20% of adults die between 50 and 70. For the first time in recorded history, the average 70-year-old is likely to live into their mid-eighties.
And here is something most people don’t fully absorb: life expectancy is a ‘climbing target’.
A child born today has a life expectancy in the early-to-mid-80s. A man who has already reached that age has, by definition, survived everything that claims younger lives — accidents, illness, events that take people earlier. His remaining life expectancy has shifted – he is now likely to live into his mid-nineties.
Life expectancy keeps climbing higher, year by year, decade by decade.
A second life
Most of our parents were well and truly retired by their seventieth birthday. But if you, like me, are somewhere in your mid-fifties, by the time we reach our seventies we’ll still have another 25 or 30 years of life ahead of us.
To put that in context: most of us entered the workforce in our early-to-mid-twenties. Most people I speak with are planning to retire within five years of sixty. If that’s you, you are likely to spend as much time in retirement as you spent working.
That is a whole second life.
“Oh no,” I often hear, “I don’t want to live that long!” This is the reaction of someone who is reliving the sad decline they watched their parents endure.
But that’s not the world you and I are ageing into.
Our lifespan is increasing, and so is the quality of our health, called ‘healthspan’. This is crucial because all this extra life is a gift or a burden depending on how much of it you spend in good health.
The healthspan gift
Medicine hasn’t cured ageing (not yet, anyway), but it is advancing in ways that increasingly defer serious decline towards the very end of life. This is not what previous generations experienced – their decline was spread across a decade or more of painful retreat from good health and independence.
The current generation’s experience of ageing, though, is that we are spending a greater proportion of our lives free of disability than our forebears. A recent study published in Nature Aging late last year tracked physical and mental capacity across generations and reached a conclusion that would have seemed improbable to our parents: today’s 70-year-olds are functioning, on most measures, the way 60-year-olds did a generation ago.
The extra years aren’t years of decline. They’re years of life.
On the eve of his 100th birthday, Dick Van Dyke said “The funniest thing is, it’s not enough. You want more life — which I plan to, at least!”
That’s not someone who can’t wait for it all to be over. That’s the voice of someone in good shape, enjoying life and keen to get the most out of what’s left.
Gerontologists call this extended period of active, independent living the “third age.” It tracks, almost perfectly, with what I’ve been describing as Retirement 3.0 — the decades that don’t look much like our outdated notions of retirement at all. Capable, engaged, demanding of resources that match the life being lived.
All this means the second life isn’t a quiet wind-down. For most of us, it will be active enough to require a plan built for exactly that. The problem is that most retirement plans weren’t built for this second life. They were built on assumptions that made perfect sense for our parents — but we’re not ageing into their world, we’re ageing into ours.
The danger of averages
The late Swedish statistician, Dr Hans Rosling, spent his impressive career warning against conclusions based on averages. This is a human tendency – to take a range of outcomes and flatten them into a single number – an average – because it feels like certainty. It isn’t.
Averages feel like answers. They give the impression of knowledge, of having measured the thing properly. But an average, by definition, hides a distribution. It collapses a wide range of real outcomes into one figure, and in doing so it hides important facts.
This matters everywhere. But it matters most when the decision you’re making is consequential, largely irreversible, and decades long.
Retirement planning, as most people have encountered it, is built on averages. A fixed return assumption. A fixed inflation rate. A fixed spending level. And a fixed lifespan — often somewhere around 85 or 88 — drawn from population data and plugged into the model as if it were a fact about you specifically.
The result is a single line on a chart, travelling smoothly from left to right, arriving at some future date with a number still attached. The line is clean. The future looks legible. The plan appears to be working.
What the line cannot show you — what it is structurally incapable of showing you — is the range of futures that might actually arrive.
What the whole picture looks like
Readers who have been following this series will recognise the chart below. For those who haven’t, here is what it shows.
Instead of a single projected line, it maps the full distribution of outcomes across a thousand simulated financial lives starting from the same position. The outcomes are sorted into three bands: the favourable two-in-ten at the top, the median six-in-ten in the middle, the adverse two-in-ten at the bottom. Threading through them is a single dashed line — one lived experience, moving between bands as life events unfold.
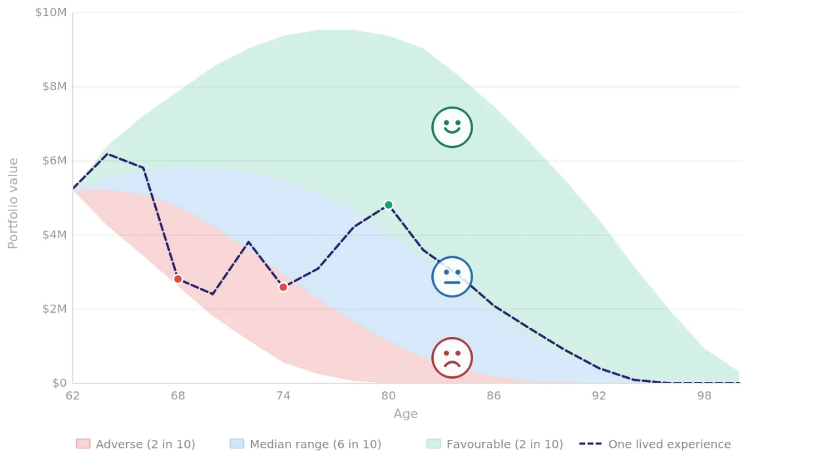
This is not pessimism dressed up as analysis. It is the honest picture that averages hide.
Notice what the chart does not try to do. It does not predict which band you will occupy. It does not tell you whether the market will cooperate in your early retirement years, or whether a health event will spike your withdrawals at 74, or whether an unexpected settlement will provide breathing room at 80. Nobody can tell you that. The chart doesn’t pretend otherwise.
What it does instead is something more useful: it shows you the full range of paths your financial life might take, and asks whether your plan holds across that range — not just in the middle of it.
The only question worth asking
Rosling’s warning about averages points to something deeper than a statistical quibble. Planning using an average means you’re forcing all the events that make your life yours – the unexpected shocks, the market drops, the health scares, the windfalls as well as the losses – all into a single line.
This approach more resembles a gamble – a bet that your future will pan out broadly like the median.
Real lives do not follow a smooth line. They travel something messier, more eventful, more human. So the question your plan needs to answer is not whether you’ll be okay if everything goes to plan, because it won’t.
It is whether you’ll be okay if it doesn’t.
This is what Full Spectrum Forecasting was designed for. It stress-tests your plan across a very broad range of possible futures, not just the median one. A plan that bears you through the worst conditions, not just the best ones. A plan built, in other words, for the life you might actually live rather than the average one you won’t.
The central promise of everything I have written in this series comes down to a single question: how do you make your money last as long as you do, whatever happens?
Full Spectrum Forecasting is the planning discipline that makes that question answerable.
The WealthSpan Letter is general financial information, not personal financial advice. Consider whether any information is appropriate to your circumstances before acting on it.